EyesOnIt's reporting & analytics features help your customers understand patterns, trends, and behaviors to make better decisions. Our advanced reporting and analytics module is built for VMS providers, integrators, and enterprise clients, you can deliver more value.
From identifying peak activity times to detecting suspicious patterns and optimizing layouts, EyesOnIt makes it easy to analyze and act on what your cameras see — all with an intuitive, exportable dashboard.
Analysts and operators alike enjoy a clean, responsive interface that works on any device.
Customizable Dashboards
Users can pin their most-used widgets, choose date range presets, and tailor the view to their needs.
Easy Exports
Every view, chart, and table can be exported as CSV, PDF, or PNG — perfect for sharing and reporting.
Enterprise-Grade Value
Add meaningful, high-impact reporting to your VMS offering with minimal effort.
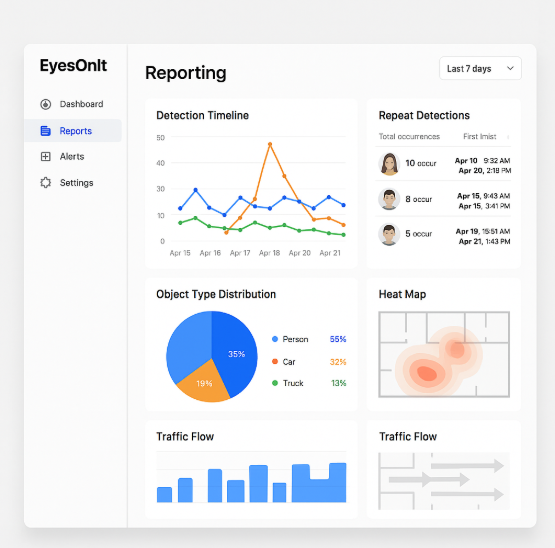
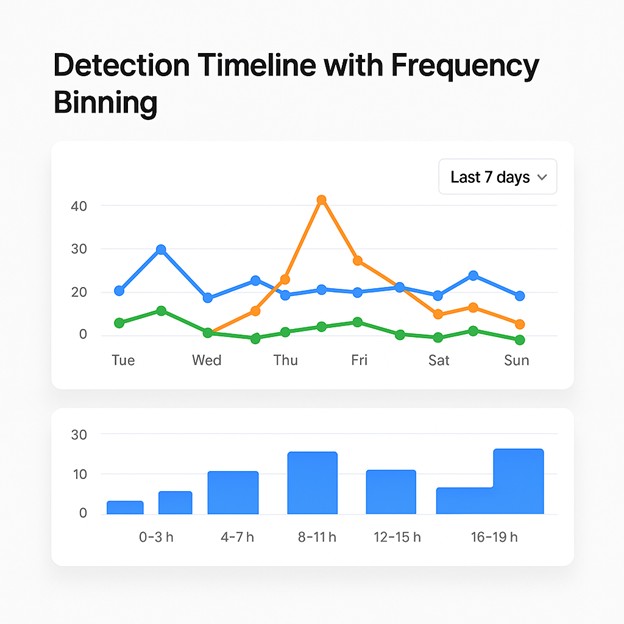
Detection Timeline with Frequency Binning
Track detections over time with an interactive line or bar chart:
👉 Spot activity & alerting trends by hour, day, or week
👉 Identify high-traffic periods or anomalies
👉 Supports proactive investigations & alerting
👉 Filter by object type, timestamp, object class, confidence score, camera name, and location
👉 Bulk actions (e.g., export to CSV/Excel, flag events)
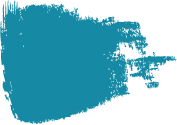
Heat Mapping & Object Type Distribution
Visualize activity intensity directly on camera feeds or site maps and get an at-a-glance view of what’s being detected.
👉 Identify spatial hotspots
👉 Optimize camera placement & staff deployment
👉 Get proportions of people, vehicles, and other object types
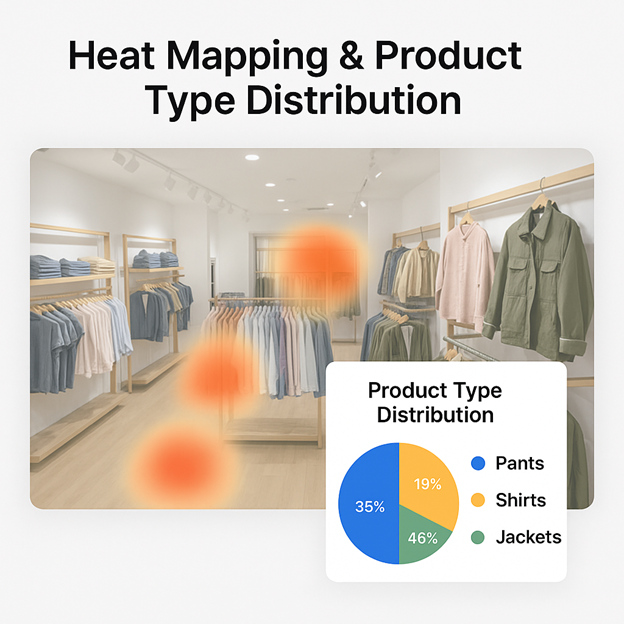
Traffic Flow Visualization
Understand how people and vehicles move through spaces.
👉 Map inferred paths with arrows & line thickness
👉 Analyze congestion and redesign layouts accordingly
👉 Recent hour/day/week view with frame-based tracing
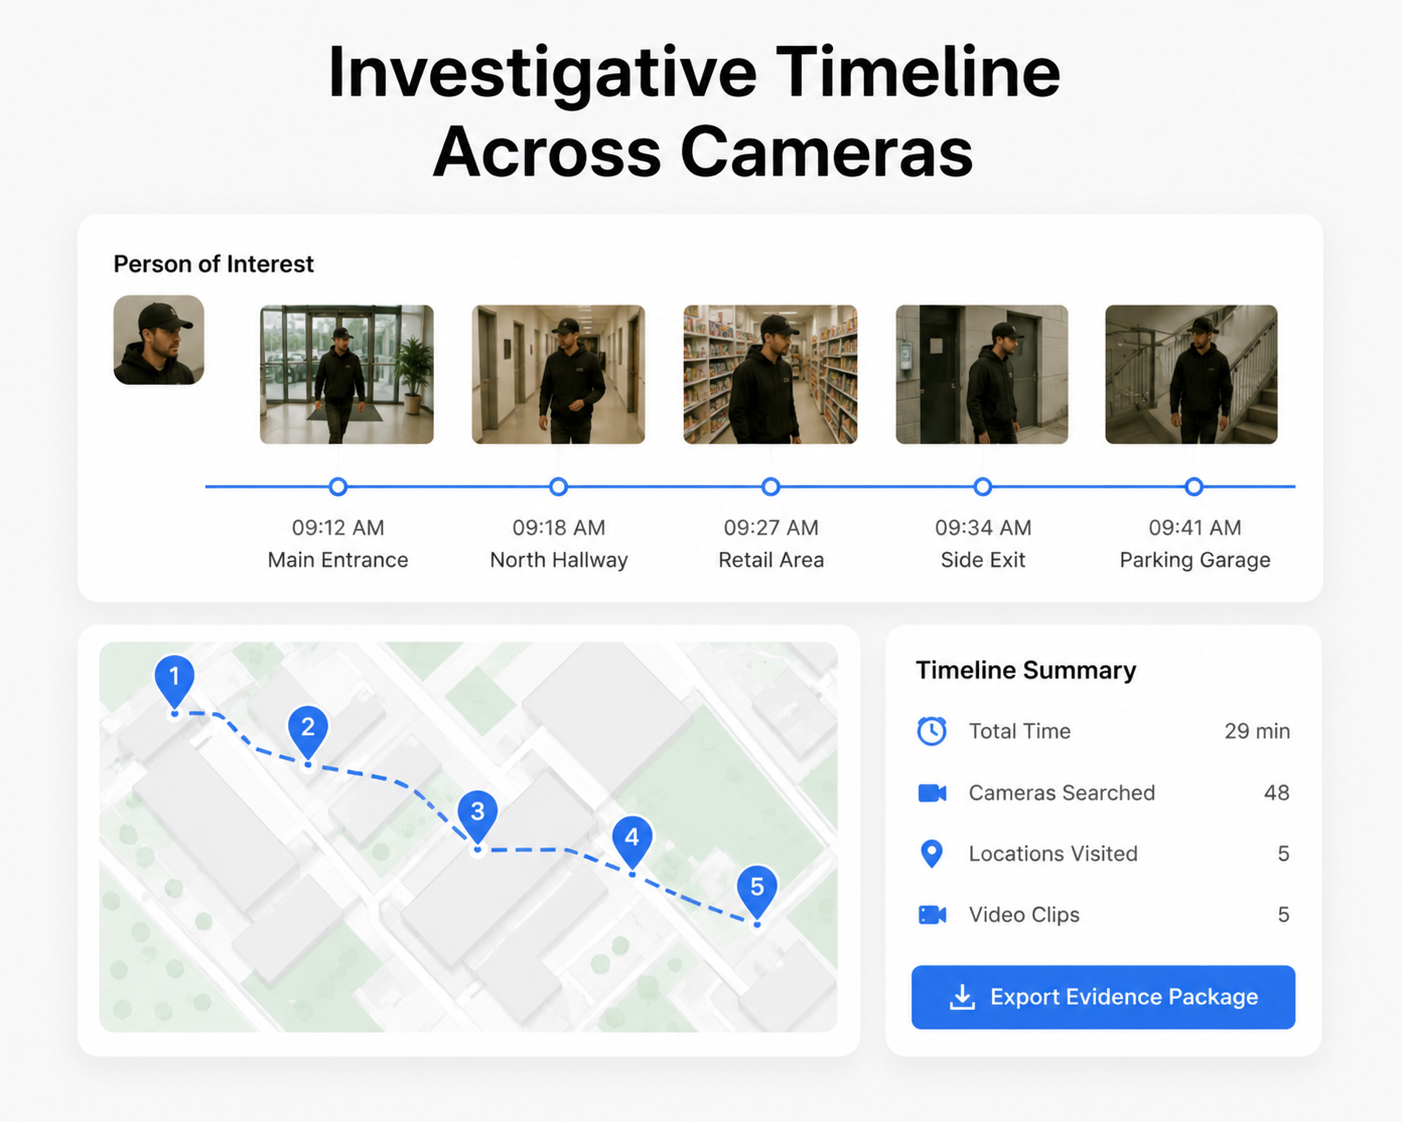
Timeline Building
Using natural language search and forensic video analytics, EyesOnIt can identify where an individual appeared, track movement across cameras, and help build a chronological timeline of activity tied to supporting video evidence.
👉 Create investigative timelines faster
👉 Reconstruct a person’s movement across facilities
👉 Organize video evidence by time and location
👉 Reduce manual post-incident video review
👉 Support evidentiary video package creation
👉 Improve incident documentation and reporting
👉 Accelerate investigations and response analysis
👉 Turn surveillance footage into actionable intelligence
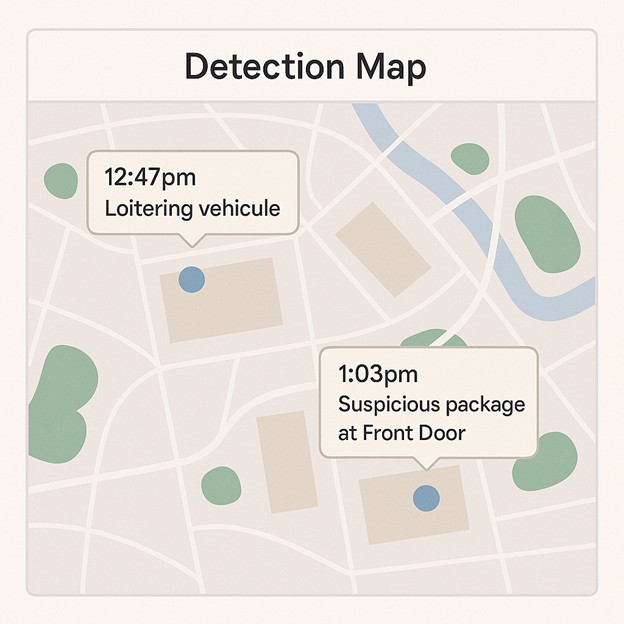
Geospatial Map View (Enterprise, Multi-Site)
View detection activity across multiple locations on an interactive map.
👉 Ideal for large enterprises with distributed sites
👉 Cluster view for dense locations
👉 Light & dark map themes with detection overlays
Interested In Learning More About EyesOnIt?
Share your specific use case for details on how our computer vision technology can help. Fill out the form below and a member of our team will be in touch.